Posts mit dem Label Owner Earnings werden angezeigt. Alle Posts anzeigen

23. Februar 2016

Sirius XM – Profitabel mit Satelliten-Radio

Ich habe hier ja bereits geschrieben, dass ich in die Aktien von Liberty Media investiert habe. Der Hauptgrund dafür ist, dass Liberty Media der größte Aktionär von Sirius XM ist und ich glaube, dass man über Liberty Media eben relativ günstig in Sirius XM investieren kann. Ein meiner Meinung nach ausgezeichnetes Unternehmen dessen separat gelistete Aktie allerdings in etwa fair bewertet ist, und somit im Gegensatz zu Liberty Media keine ausreichende Sicherheitsmarge bietet. Ich möchte hier meine Gedanken zu Sirius XM festhalten.

Vorgeschichte

Der Vorläufer von Sirius XM, Sirius, hat sein Geschäft um 2002 herum gestartet. Die ersten Jahre waren geprägt durch den Aufbau des Geschäfts. Es ist nicht verwunderlich, dass bis zum Merger mit XM Satellite im Jahr 2008 eigentlich nur Verluste angefallen sind, und zwar recht heftige (das Cash-Flow-Profil eines Satelliten ist in den ersten Jahren stark negativ, die Amortisation dauert einige Jahre; außerdem muss auch erst ein Kundenstamm aufgebaut werden, wofür man attraktive Programme braucht usw). Ab 2008/2009 hat die nun zusammengelegte Gesellschaft zwar operativ den Break-Even erreicht, allerdings war die Finanzverschuldung zu diesem Zeitpunkt schon so hoch, dass
  • die Zinslast den operativen Gewinn fraß und das Nettoergebnis immer noch negativ war
  • der Pleitegeier schon dachte, sich den Bauch vollschlagen zu können.
Wer noch in Erinnerung hat was 2008/2009 los war kann sich auch denken, dass die Refinanzierung in dieser Zeit nicht gerade ein Zuckerschlecken war. Einer der wenigen, die damals sahen welches Potenzial in Sirius XM steckt und auch die nötigen Mittel hatte um beizuspringen, war John Malone. Er hat sich im Zuge der Refinanzierung, no na, auch eine nicht unwesentliche Beteiligung am Eigenkapital gesichert. Heute befindet sich Sirius XM zu über 60% im Besitz von Liberty Media.

Radio

Der Bedarf nach Radio-Rundfunk ist prinzipiell sehr hoch und auch stabil. Der durchschnittliche US-Amerikaner konsumiert anscheinend täglich vier Stunden akustischen Allerleis. Den Löwenanteil dieser Nachfrage befriedigt das klassische Radioprogramm, das sich hauptsächlich durch Werbeeinschaltungen finanziert (in Österreich dürfen wir zusätzlich noch GIS zahlen – alle, auch die die nicht zuhören; aber lassen wir diese Seitenhiebe auf den ORF). Andere werbefinanzierte Angebote umfassen Dienste wie Spotify, Pandora oder auch Youtube. Ich bin mir sicher, dass ich nicht alle Angebote aufzählen kann - es existieren Massen davon.

Als Gegenmodell zum werbefinanzierten Angebot gibt es auch Abo-basierte Modelle, wo meist für eine fixe (meist monatliche) Gebühr so viel gehört werden kann, wie der Kunde das eben wünscht, mit personalisierten Inhalten und sonstigem Schnick-Schnack. In diesem Bereich ist das Angebot etwas überschaubarer (obwohl ich sicher auch nicht alle aufzählen kann), und es entspricht dem Geschäftsmodell von Sirius XM – dem Platzhirsch in den USA (und durch Sirius XM Canada auch in Kanada).

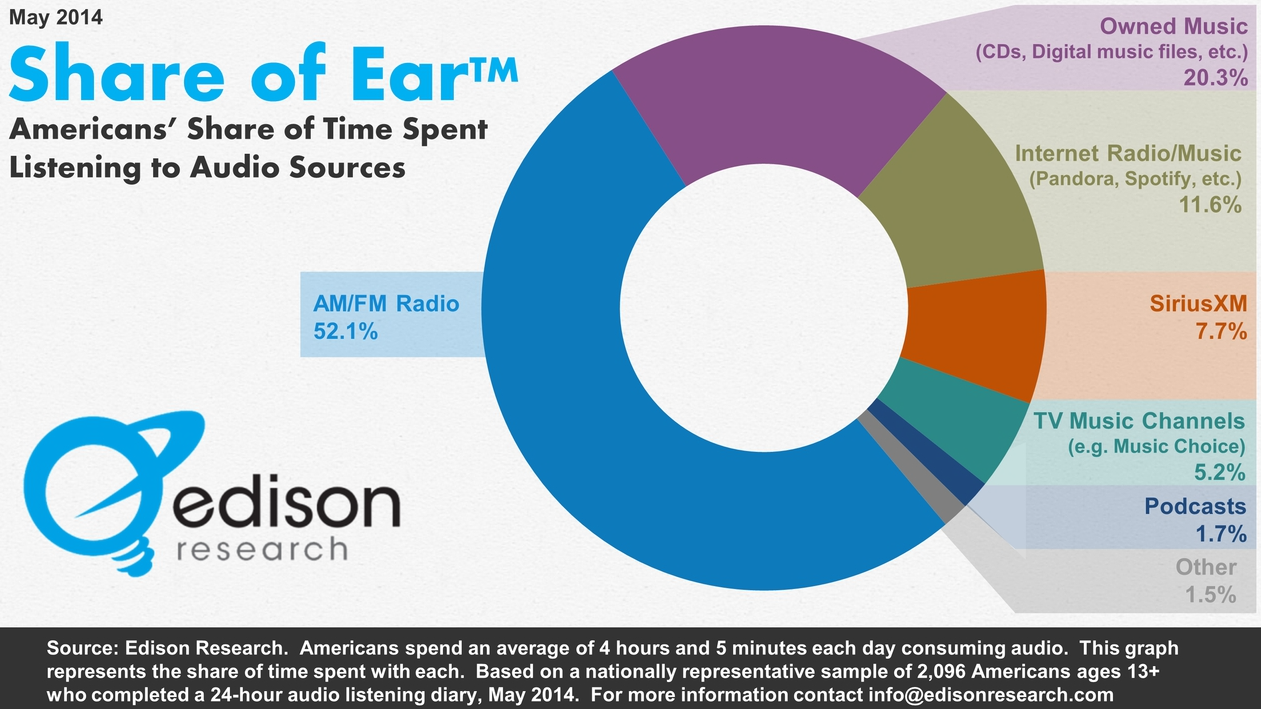
Quelle: Edison Research
Geschäftsmodell

Sirius XM bietet ein Abo-basiertes Radioprogramm mit über 170 Kanälen, das
  • sowohl über das eigene Satellitensystem (mit 9 Satelliten, großteils geostationär)
  • als auch über Internet und entsprechende Apps

USA-weit empfangen werden kann.

Das Geschäftsmodell ist stark skalierbar (Satelliten, Werbung, Programm, …) und produziert sehr starke Cash-Flows, letzteres vor allem wegen dem Abo-Modell (Kunden zahlen im Voraus).

Links: Anzahl Abos in Mio., Rechts: Umsatz & operatives Ergebnis (USD pro Abo und Jahr). „Other“ (gelb) hat mit dem Radio-Abo-Geschäft nicht viel zu tun, ich habe es aber als zusätzliches Einkommen pro Abo hinzugerechnet, weil kein separater Erfolgsnachweis für diese Geschäfte ausgewiesen wird.
Um die Sinnhaftigkeit des eigenen Satelliten-Netzes zu verstehen, ist es notwendig sich über die Autofahrer Amerikas Gedanken zu machen. Das ist nämlich was die meisten Sirius XM Kunden sind: Autofahrer. Die Strecken sind lang (die Kunden verbringen im Schnitt über 90 Minuten pro Tag im Auto) und Sirius XM bietet mit seinem Service ein abwechslungsreiches Programm, das nicht von Werbeeinschaltungen unterbrochen wird und durch die Satelliten-Abdeckung lückenlos auf dem ganzen Kontinent verfügbar ist. Ich glaube, dass die Ängste um das Geschäftsmodell, die durch den technologischen Fortschritt ausgelöst werden und momentan das Hauptargument der Bären sind, überzogen sind (einfaches Integrieren von Apps, Smartphones oder ähnliches ins Auto, was Sirius XM überflüssig machen könnte), zumal überhaupt nicht klar ist,
  • ob nicht-Satelliten-basierte Dienste auf abgelegenen Landstraßen überhaupt verfügbar sind,
  • wie lange es noch dauert bis sie verfügbar sind,
  • und wenn doch verfügbar, wie viel der Zugang kostet.

Abgesehen davon ist die Art und Weise, wie der Zugang zum Sirius XM Programm technologisch ermöglicht wird, meines Erachtens gar nicht so wichtig, wie viele Beobachter glauben. Es war bisher, und ist es in vielen Gebieten immer noch, schlicht und einfach nur per Satellit möglich den Inhalt flächendeckend zu liefern. Wer sich einmal angesehen hat, was reine Satelliten-Netz-Betreiber wie Intelsat, Eutelsat oder SES für Margen einstreifen, kann sich auch leicht vorstellen, dass ein eigenes Satelliten-Netz schlicht und einfach billiger ist als sich dort Kapazitäten mieten zu müssen, wenn man eine kritische Masse an Kunden sowieso überschreitet. Das Satelliten-Netz ist meines Erachtens mehr ein (zugegebenermaßen sehr effektives) Mittel zum Zweck, und nicht das eigentliche Geheimnis des Erfolges von Sirius XM.

Our streaming “competitors” are often simply repackaging highly commoditized music and many questions remain as to the business model of these music-only streaming services.  There will be more competition in the car going forward, but the strong value proposition of SiriusXM is based on ease of use, unique content, and a technological beachhead created by an installed device in over 70 million cars. 
Gregory Maffei (CEO), John Malone (Chairman) – Annual Report Liberty Media 2014

Ich denke der technologische Fortschritt könnte sogar eine Chance sein, „aus dem Auto hinaus zu expandieren“, da der Service mit Internetverbindung und App auch sonst überall genutzt werden kann. Der Schlüssel liegt in obigem Zitat: Sirius XM bietet nicht nur Musik, sondern auch anderen Content wie Nachrichten (CNN, Fox News, …), Sportübertragungen (NFL, MLB, in Kanada NHL, …), Talkshows (unter anderem den legendären Howard Stern) und anderes im Exklusiv-Angebot, alles in einem Abo. Im Gegensatz zur Konkurrenz erhält der Kunde eben viel mehr als nur Musik, und das ist die große Stärke von Sirius XM. Die Tatsache, dass die Kundenanzahl stetig wächst, ist ein Beleg dafür - den es natürlich laufend zu beobachten gilt. 

Wie kommt Sirius XM ins Auto?

Durch Beziehungen zu beinahe allen Autobauern, die beim Verkauf ein Test-Abo mitliefern. Momentan werden in etwa 40% aller Test-Abos nach Ablauf in zahlende Kunden umgewandelt, da sie das Abo eben kostenpflichtig verlängern. Der Anteil der Kunden die das Abo kündigen liegt seit Jahren bei knapp unter 2% was zeigt, dass die Kunden ziemlich treu sind, wenn sie sich einmal an den Dienst gewöhnt haben.

Zusätzlich dazu werden in letzter Zeit verstärkt Beziehungen zu Gebrauchtwagenhändlern eingegangen, um die Kundengewinnung über diesen Kanal ebenfalls anzutreiben.

Diese Beziehungen stellen zumindest einen ebenso wichtigen Teil des Buffett'schen Burggrabens dar, wie das Satelliten-Netz.

Eine ganz simple Bewertung

Sirius XM schüttet keine Dividende aus, sondern steckt operativ nicht benötigtes Kapital in Aktienrückkäufe. Dadurch steigt der Gewinn pro Aktie schneller als der buchhalterische Konzerngewinn. Dieser selbst wird wiederum durch einige Bilanzierungseigenheiten und Sondereffekte stark verzerrt und unterschätzt meines Erachtens den ökonomischen Gewinn. Ich verweise wieder einmal auf Warren Buffetts Owner Earnings und gebe hier meine Schätzung selbiger wieder: ich denke Sirius XM verdient momentan so um die 18 bis 20 US-Cent je Aktie, was deutlich mehr ist, als die offiziell ausgewiesenen 9 US-Cent.

Unter dem Hinweis, dass ich kein Buchhalter bin, nur schätze und ich, bevor jemand diese Schätzung zu ernst nimmt, eindrücklich warne und empfehle, sich das selbst durch zu überlegen: nehmen wir an ich läge damit halbwegs richtig. Bei einem Kurs von USD 3,70 entspräche das einem angepassten KGV zwischen 18,5 und 20. Angesichts des soliden Wachstumspotenzials und dem hohen ROIC halte ich das für, naja, eben eine halbwegs faire Bewertung.

Zusammenfassung

Alles in allem scheint mir Sirius XM eine erfolgreiche Zukunft vor sich zu haben. Allerdings halte ich die Aktie für in etwa fair bewertet. Unsicherheiten bei der Bewertung umfassen zum einen die NOLs  die sich angesammelt haben, zum anderen ist die Finanzverschuldung relativ hoch. Letzteres ist bei Malone nicht unüblich und sollte, wenn überhaupt, nur in Zusammenhang mit relativ stabilen Cash-Flows wie im Falle dieses Abo-basierten Geschäftsmodells gemacht werden. Ich gebe zu, das ist das einzige was mir bei dem Unternehmen etwas Sorgen macht. Vor allem weil sie es in den Lehman-Crash hinein ja schon einmal übertrieben haben, auch wenn Sirius XM heute im Gegensatz zu damals profitabel arbeitet.

Ich halte ein Investment über Liberty Media, die (wie schon erwähnt) über das Wikifolio nicht investierbar ist, für vielversprechender als in direktes Investment in die Sirius XM Aktie. Die Sirius XM Aktie wäre zwar über Wikifolio investierbar… vielleicht wird das ja mal was, wenn der Kurs stärker nachgibt.


Quellen

17. November 2014

Owner Earnings

In diesem Post geht es nicht um eine spezielle Investmentidee sondern darum, wie man die ausgewiesenen Gewinne von Unternehmen interpretiert. Bilanzierungsregeln sind kompliziert, und ab und an trifft man auf Unternehmen, deren Gewinn- und Verlustrechnungen ein ganzes Stück weit weg von der fundamentalen Ertragskraft sind, die hinter diesen Zahlen steht. Um die Ertragskraft zu messen, empfiehlt Berkshire Hathaway das Konzept der Owner Earnings, für deren Berechnung/Schätzung sowohl Daten aus der GuV, der Bilanz und der Kapitalflussrechnung benötigt werden (meist inklusive Vermerke im Anhang zum Konzernabschluss). 

Das Internet ist voll von Zitaten von Warren Buffett - meist kurze, knackige Sätze. Wer jedoch selber investieren will, sollte auch längeren Texten aus seiner Feder Beachtung schenken. Der hier vorgestellte Aufsatz ist einer von denen die mir persönlich am besten gefallen, weil das Konzept der Owner Earnings in meinen Augen Sinn macht und mir heute noch genauso viel nutzt wie früher, als ich angefangen habe, mir die ersten Bilanzen durchzulesen.

Ich habe mir angewöhnt, die Owner Earnings immer zu schätzen wenn ich mir ein Investment überlege, um die Qualität der ausgewiesenen Gewinne zu überprüfen. Es gibt genügend Unternehmen bei denen mir das nicht wirklich möglich ist, weil mir die Konzernbilanzen einfach zu kompliziert/nicht interpretierbar sind, was meist damit zusammenhängt dass ich das Geschäftsmodell nicht verstehe – ein Investment kommt dann schlicht und einfach nicht in Frage. Die Schätzung der Owner Earnings ist zeitaufwendig, da man sich zuerst die Zahlen besorgen muss, mit denen man rechnen will (Daten von Finanzportalen sind meist viel zu ungenau, zumindest die die gratis sind; ein Zugang zu einer Datenbank wie Capital IQ oder ähnliches ist mir wiederum zu teuer seit ich mit dem Studium fertig bin – heißt also: aus den Geschäftsberichten abtippen). Ich glaube aber, dass ich dadurch schon einigen Value-Traps entgangen bin.

Der folgende Text stammt aus dem Geschäftsbericht von Berkshire Hathaway von 1986, in dem Warren Buffett das Konzept der Owner Earnings anhand der damaligen Übernahme von Scott Fetzer erklärt – und auch darlegt, warum die einen oft erschlagenden Cash Flow- und EBITDA-Kennzahlen meist relativ wertlos sind. Ich habe mir überlegt, selbst einen Text zu verfassen, aber könnte den Sachverhalt wohl eh nicht so gut erklären. Außerdem ist Buffett’s Text, zumindest dafür dass es um Buchhaltung geht, recht amüsant geschrieben und immer noch aktuell, wenn auch nicht in allen Details: Goodwill wird heute nicht mehr regelmäßig abgeschrieben, sondern einem jährlichen Impairment-Test unterzogen, anderes aus Übernahmen entstandenes immaterielles Vermögen wir aber nach wie vor regelmäßig abgeschrieben (Customer relationships und ähnliches). 

Anmerkung: Wer den Text lieber in deutsch lesen würde: ich habe keine deutsche Übersetzung zum Posten zur Verfügung. Vielleicht kann Google helfen (als Microsoft-Aktionär müsste ich ja Bing empfehlen, aber das kennen halt nicht viele), ansonsten empfiehlt sich die deutsche Übersetzung des Buches von Lawrence Cunningham, in dem der Text enthalten ist. Auf Amazon: Essays von Warren Buffett: Das Buch für Investoren und Unternehmer


Aus dem Appendix des Geschäftsberichts 1986 von Berkshire Hathaway

Purchase-Price Accounting Adjustments and the "Cash Flow" Fallacy

First a short quiz: below are abbreviated 1986 statements of earnings for two companies. Which business is the more valuable?

Anklicken zum Vergößern
As you've probably guessed, Companies O and N are the same business - Scott Fetzer. In the "O" (for "old") column we have shown what the company's 1986 GAAP earnings would have been if we had not purchased it; in the "N" (for "new") column we have shown Scott Fetzer's GAAP earnings as actually reported by Berkshire.

It should be emphasized that the two columns depict identical economics - i.e., the same sales, wages, taxes, etc. And both "companies" generate the same amount of cash for owners. Only the accounting is different.

So, fellow philosophers, which column presents truth? Upon which set of numbers should managers and investors focus?

Before we tackle those questions, let's look at what produces the disparity between O and N. We will simplify our discussion in some respects, but the simplification should not produce any inaccuracies in analysis or conclusions.

The contrast between O and N comes about because we paid an amount for Scott Fetzer that was different from its stated net worth. Under GAAP, such differences - such premiums or discounts - must be accounted for by "purchase-price adjustments." In Scott Fetzer's case, we paid $315 million for net assets that were carried on its books at $172.4 million. So we paid a premium of $142.6 million.

The first step in accounting for any premium paid is to adjust the carrying value of current assets to current values. In practice, this requirement usually does not affect receivables, which are routinely carried at current value, but often affects inventories. Because of a $22.9 million LIFO reserve and other accounting intricacies, Scott Fetzer's inventory account was carried at a $37.3 million discount from current value. So, making our first accounting move, we used $37.3 million of our $142.6 million premium to increase the carrying value of the inventory.

Assuming any premium is left after current assets are adjusted, the next step is to adjust fixed assets to current value. In our case, this adjustment also required a few accounting acrobatics relating to deferred taxes. Since this has been billed as a simplified discussion, I will skip the details and give you the bottom line: $68.0 million was added to fixed assets and $13.0 million was eliminated from deferred tax liabilities. After making this $81.0 million adjustment, we were left with $24.3 million of premium to allocate.

Had our situation called for them two steps would next have been required: the adjustment of intangible assets other than Goodwill to current fair values, and the restatement of liabilities to current fair values, a requirement that typically affects only long-term debt and unfunded pension liabilities. In Scott Fetzer's case, however, neither of these steps was necessary.

The final accounting adjustment we needed to make, after recording fair market values for all assets and liabilities, was the assignment of the residual premium to Goodwill (technically known as "excess of cost over the fair value of net assets acquired"). This residual amounted to $24.3 million. Thus, the balance sheet of Scott Fetzer immediately before the acquisition, which is summarized below in column O, was transformed by the purchase into the balance sheet shown in column N. In real terms, both balance sheets depict the same assets and liabilities - but, as you can see, certain figures differ significantly.

Anklicken zum Vergrößern
The higher balance sheet figures shown in column N produce the lower income figures shown in column N of the earnings statement presented earlier. This is the result of the asset write-ups and of the fact that some of the written-up assets must be depreciated or amortized. The higher the asset figure, the higher the annual depreciation or amortization charge to earnings must be. The charges that flowed to the earnings statement because of the balance sheet write-ups were numbered in the statement of earnings shown earlier:
  1. $4,979,000 for non-cash inventory costs resulting, primarily, from reductions that Scott Fetzer made in its inventories during 1986; charges of this kind are apt to be small or non-existent in future years.
  2. $5,054,000 for extra depreciation attributable to the write-up of fixed assets; a charge approximating this amount will probably be made annually for 12 more years.
  3. $595,000 for amortization of Goodwill; this charge will be made annually for 39 more years in a slightly larger amount because our purchase was made on January 6 and, therefore, the 1986 figure applies to only 98% of the year.
  4. $998,000 for deferred-tax acrobatics that are beyond my ability to explain briefly (or perhaps even non-briefly); a charge approximating this amount will probably be made annually for 12 more years.
It is important to understand that none of these newly-created accounting costs, totaling $11.6 million, are deductible for income tax purposes. The "new" Scott Fetzer pays exactly the same tax as the "old" Scott Fetzer would have, even though the GAAP earnings of the two entities differ greatly. And, in respect to operating earnings, that would be true in the future also. However, in the unlikely event that Scott Fetzer sells one of its businesses, the tax consequences to the "old" and "new" company might differ widely.

By the end of 1986 the difference between the net worth of the "old" and "new" Scott Fetzer had been reduced from $142.6 million to $131.0 million by means of the extra $11.6 million that was charged to earnings of the new entity. As the years go by, similar charges to earnings will cause most of the premium to disappear, and the two balance sheets will converge. However, the higher land values and most of the higher inventory values that were established on the new balance sheet will remain unless land is disposed of or inventory levels are further reduced.

* * *

What does all this mean for owners? Did the shareholders of Berkshire buy a business that earned $40.2 million in 1986 or did they buy one earning $28.6 million? Were those $11.6 million of new charges a real economic cost to us? Should investors pay more for the stock of Company O than of Company N? And, if a business is worth some given multiple of earnings, was Scott Fetzer worth considerably more the day before we bought it than it was worth the following day?

If we think through these questions, we can gain some insights about what may be called "owner earnings." These represent (a) reported earnings plus (b) depreciation, depletion, amortization, and certain other non-cash charges such as Company N's items (1) and (4) less ( c) the average annual amount of capitalized expenditures for plant and equipment, etc. that the business requires to fully maintain its long-term competitive position and its unit volume. (If the business requires additional working capital to maintain its competitive position and unit volume, the increment also should be included in ( c). However, businesses following the LIFO inventory method usually do not require additional working capital if unit volume does not change.)

Our owner-earnings equation does not yield the deceptively precise figures provided by GAAP, since( c) must be a guess - and one sometimes very difficult to make. Despite this problem, we consider the owner earnings figure, not the GAAP figure, to be the relevant item for valuation purposes - both for investors in buying stocks and for managers in buying entire businesses. We agree with Keynes's observation: "I would rather be vaguely right than precisely wrong."

The approach we have outlined produces "owner earnings" for Company O and Company N that are identical, which means valuations are also identical, just as common sense would tell you should be the case. This result is reached because the sum of (a) and (b) is the same in both columns O and N, and because( c) is necessarily the same in both cases.

And what do Charlie and I, as owners and managers, believe is the correct figure for the owner earnings of Scott Fetzer? Under current circumstances, we believe ( c) is very close to the "old" company's (b) number of $8.3 million and much below the "new" company's (b) number of $19.9 million. Therefore, we believe that owner earnings are far better depicted by the reported earnings in the O column than by those in the N column. In other words, we feel owner earnings of Scott Fetzer are considerably larger than the GAAP figures that we report.

That is obviously a happy state of affairs. But calculations of this sort usually do not provide such pleasant news. Most managers probably will acknowledge that they need to spend something more than (b) on their businesses over the longer term just to hold their ground in terms of both unit volume and competitive position. When this imperative exists - that is, when ( c) exceeds (b) - GAAP earnings overstate owner earnings. Frequently this overstatement is substantial. The oil industry has in recent years provided a conspicuous example of this phenomenon. Had most major oil companies spent only (b) each year, they would have guaranteed their shrinkage in real terms.

All of this points up the absurdity of the "cash flow" numbers that are often set forth in Wall Street reports. These numbers routinely include (a) plus (b) - but do not subtract ( c) . Most sales brochures of investment bankers also feature deceptive presentations of this kind. These imply that the business being offered is the commercial counterpart of the Pyramids - forever state-of-the-art, never needing to be replaced, improved or refurbished. Indeed, if all U.S. corporations were to be offered simultaneously for sale through our leading investment bankers - and if the sales brochures describing them were to be believed - governmental projections of national plant and equipment spending would have to be slashed by 90%.

"Cash Flow", true, may serve as a shorthand of some utility in descriptions of certain real estate businesses or other enterprises that make huge initial outlays and only tiny outlays thereafter. A company whose only holding is a bridge or an extremely long-lived gas field would be an example. But "cash flow" is meaningless in such businesses as manufacturing, retailing, extractive companies, and utilities because, for them, ( c) is always significant. To be sure, businesses of this kind may in a given year be able to defer capital spending. But over a five- or ten-year period, they must make the investment - or the business decays.

Why, then, are "cash flow" numbers so popular today? In answer, we confess our cynicism: we believe these numbers are frequently used by marketers of businesses and securities in attempts to justify the unjustifiable (and thereby to sell what should be the unsalable). When (a) - that is, GAAP earnings - looks by itself inadequate to service debt of a junk bond or justify a foolish stock price, how convenient it becomes for salesmen to focus on (a) + (b). But you shouldn't add (b) without subtracting ( c) : though dentists correctly claim that if you ignore your teeth they'll go away, the same is not true for ( c) . The company or investor believing that the debt-servicing ability or the equity valuation of an enterprise can be measured by totaling (a) and (b) while ignoring ( c) is headed for certain trouble.

* * *

To sum up: in the case of both Scott Fetzer and our other businesses, we feel that (b) on an historical-cost basis - i.e., with both amortization of intangibles and other purchase-price adjustments excluded - is quite close in amount to ( c) . (The two items are not identical, of course. For example, at See's we annually make capitalized expenditures that exceed depreciation by $500,000 to $1 million, simply to hold our ground competitively.) Our conviction about this point is the reason we show our amortization and other purchase-price adjustment items separately in the table on page 8 and is also our reason for viewing the earnings of the individual businesses as reported there as much more closely approximating owner earnings than the GAAP figures.

Questioning GAAP figures may seem impious to some. After all, what are we paying the accountants for if it is not to deliver us the "truth" about our business. But the accountants' job is to record, not to evaluate. The evaluation job falls to investors and managers.

Accounting numbers, of course, are the language of business and as such are of enormous help to anyone evaluating the worth of a business and tracking its progress. Charlie and I would be lost without these numbers: they invariably are the starting point for us in evaluating our own businesses and those of others. Managers and owners need to remember, however, that accounting is but an aid to business thinking, never a substitute for it.